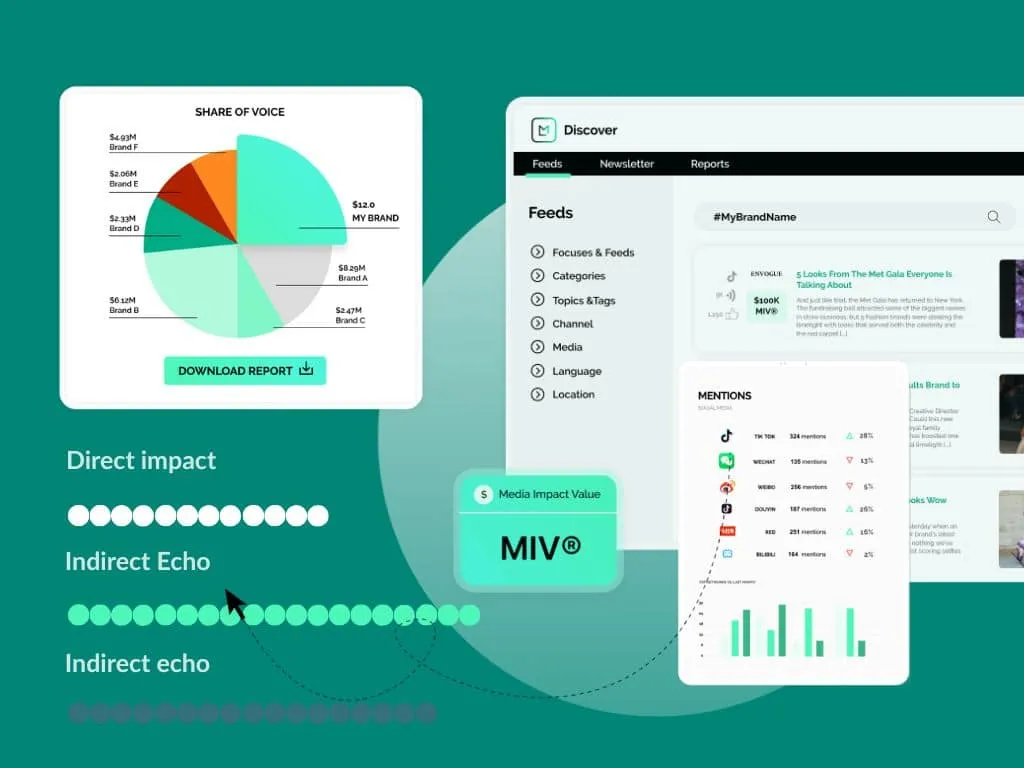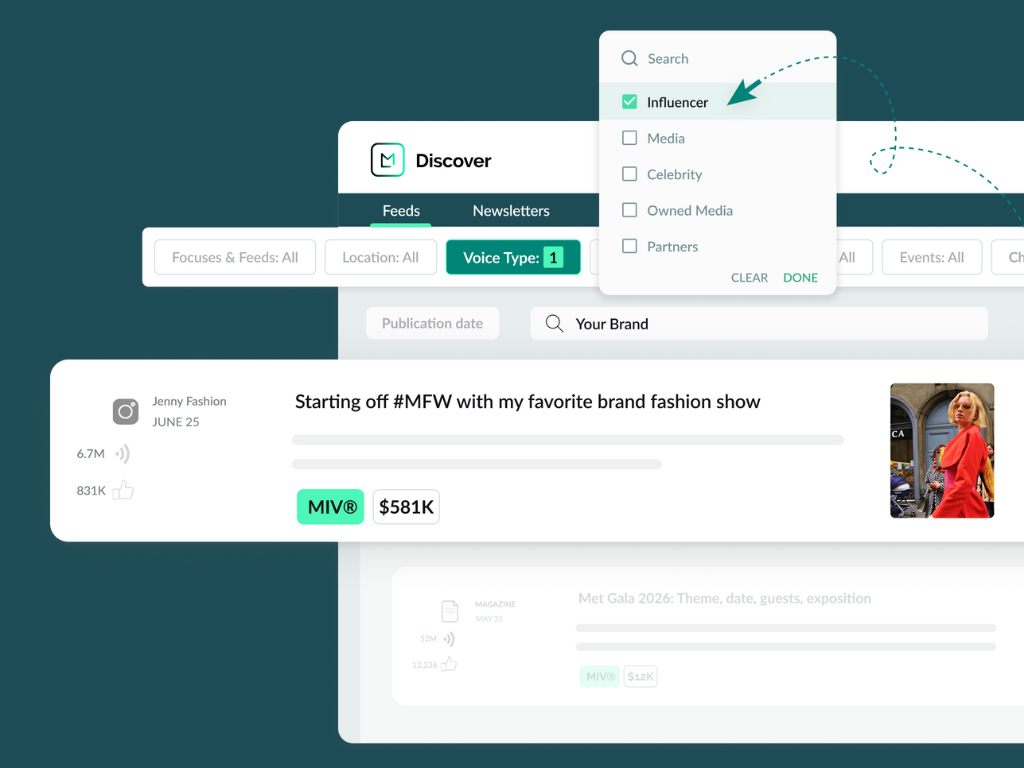
During Fashion Week, the runway sets the scene for your collections, while the seats are filled with Voices ready to amplify and generate your brand performance. Across Media, Celebrities, Influencers, Partners and Owned Media, each Voice plays a crucial role in shaping your brand’s visibility.
Once the lights dim and the venue empties, every brand leader asks the same question: How did we do?
On the surface, the answer might look obvious. Press clippings, influencer posts or perhaps even a front-row celebrity moment that still lingers in your notifications. But true performance isn’t measured in siloes or fragments. Instead, it’s about understanding which Voices actually drove your story and how your results compare to competitors who shared the same stage.
That’s where Brand Focus within Launchmetrics Insights steps in.
What is Brand Focus in Launchmetrics Insights?
Launchmetrics Insights is a benchmarking platform built for Fashion, Lifestyle and Beauty (FLB) brands. It quantifies visibility across Voices, regions and channels using Media Impact Value® (MIV®), allowing teams to measure performance and benchmark their impact against competitors.
Within Insights, Brand Focus is a single-view capability that enables brands to dive deep into one particular brand’s marketing effectiveness. This helps to uncover how your brand, or a competitor, performed by region, channel and Voice.
How Does Brand Focus Work?
Brand Focus works by isolating one brand’s performance and enables users to examine it in greater detail through data visualization.
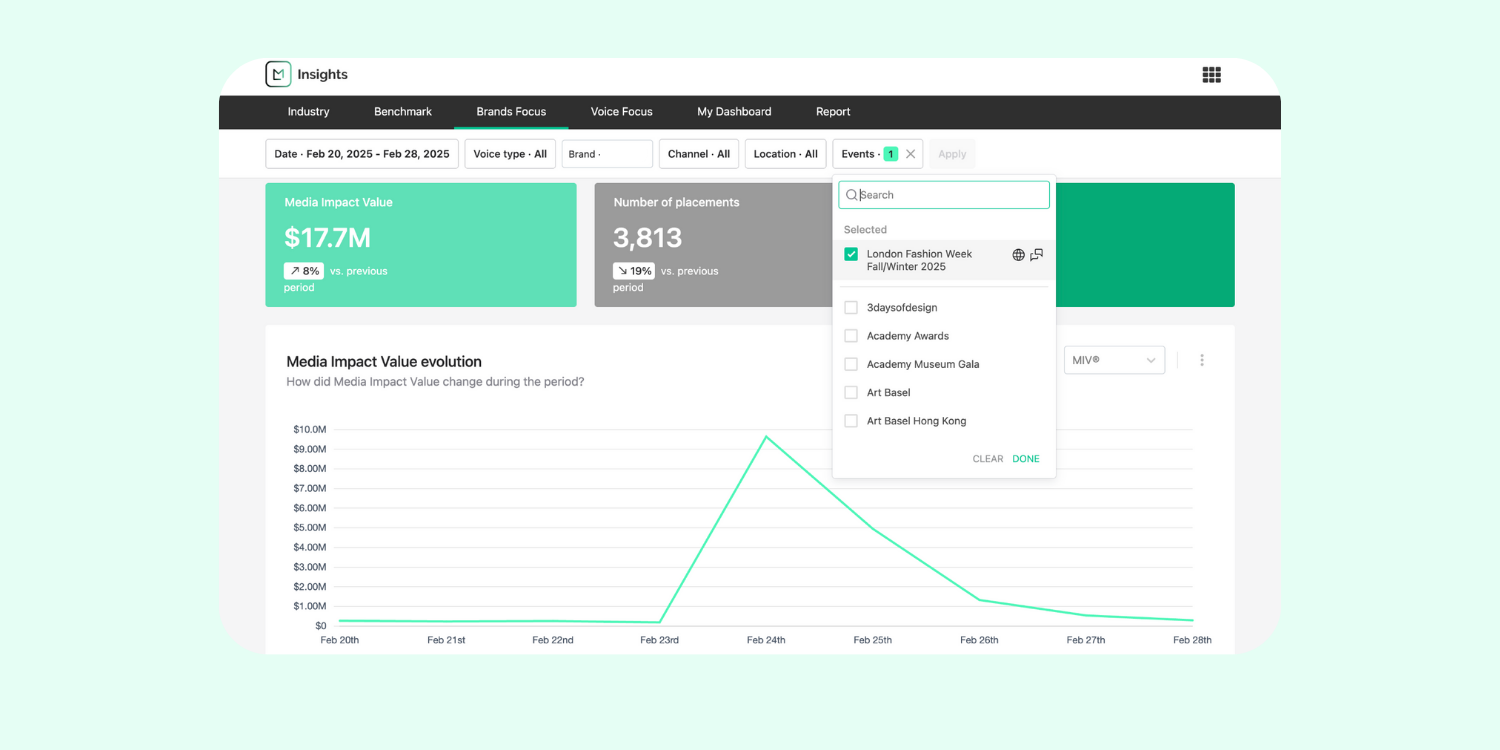
By filtering between events, Voices or regions and more, it reveals where coverage came from, which activations performed strongest and how performance evolved over time. For example, showing whether your brand gained more visibility at London Fashion Week and whether your ambassadors generated MIV in key markets like China or the US.
Within the feature, you also have the option to view performance in “Overview” to see results across all Voices or you can explore a specific Voice to understand its individual contribution to your brand’s visibility.
What Does Brand Focus Reveal?
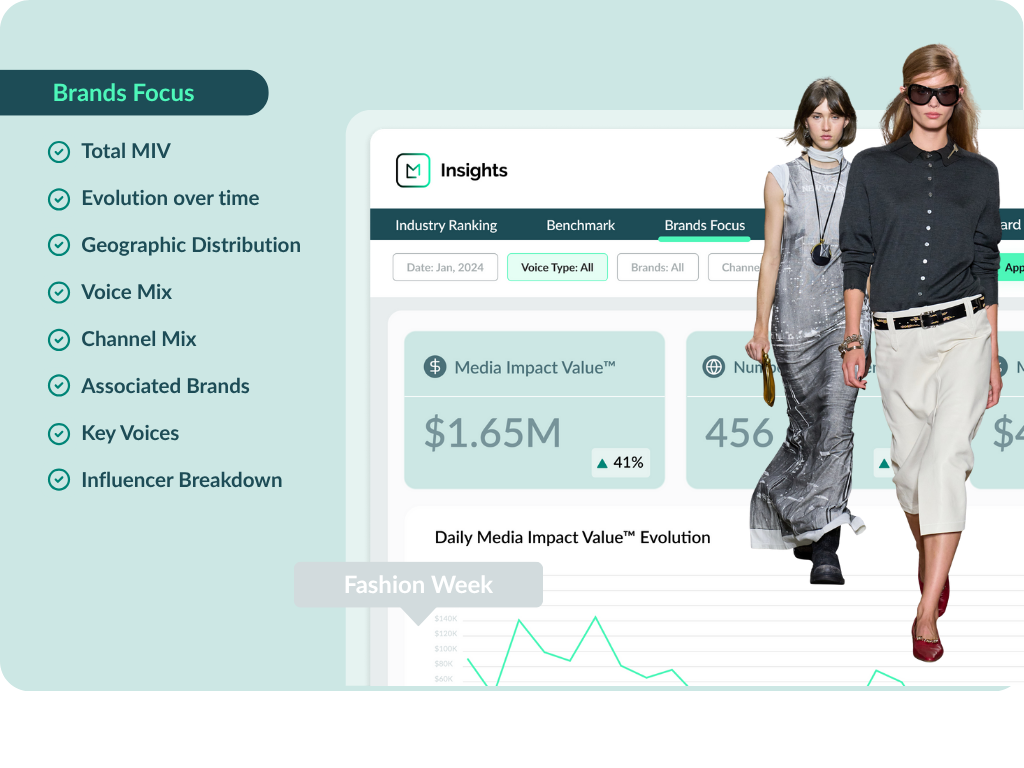
In each view, you can explore your MIV and/or placement performance depending on your selected filters, including:
- Total MIV, Placements and MIV per Placement: to understand overall visibility and the impact of each mention.
- Graphs showing MIV and placement evolution over time: visualize and identify key moments that drove peaks in performance.
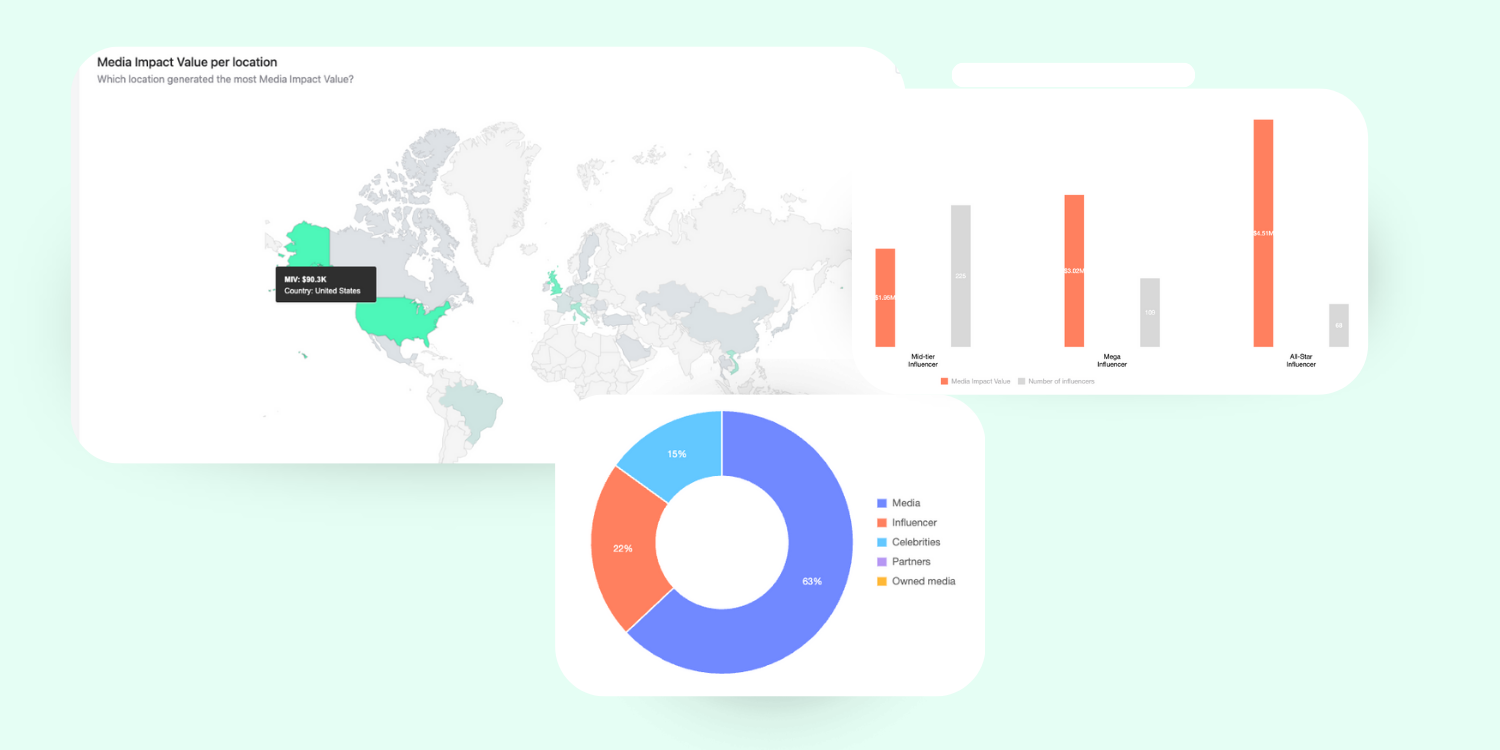
- Geographic Distribution of MIV and Placements: see where your brand gained the most traction globally.
- Voice Mix and its Evolution: track which Voices are driving impact and how their influence shifts over time.
- Channel Mix: learn whether print, online or social delivered more MIV and placements.
- Associated Brands: which brands your name appears alongside to assess audience alignment and positioning.
- Key Individual Voices: top-performers contributing to your brand visibility.
- Top 30 Placements: the highest-value articles, posts, or mentions generating the most MIV.
- Influencer Type Breakdown and Corresponding MIV (Influencer Mode): understand which creator tiers deliver the most efficient return on visibility.
These metrics allow teams to uncover patterns, identify performance drivers and explore new opportunities for optimization. To see how this works in practice, let’s look at it through the lens of post–Fashion Week reporting.
Did the Front Row Pay Off? How a Global Communications Manager Measured Fashion Week Success
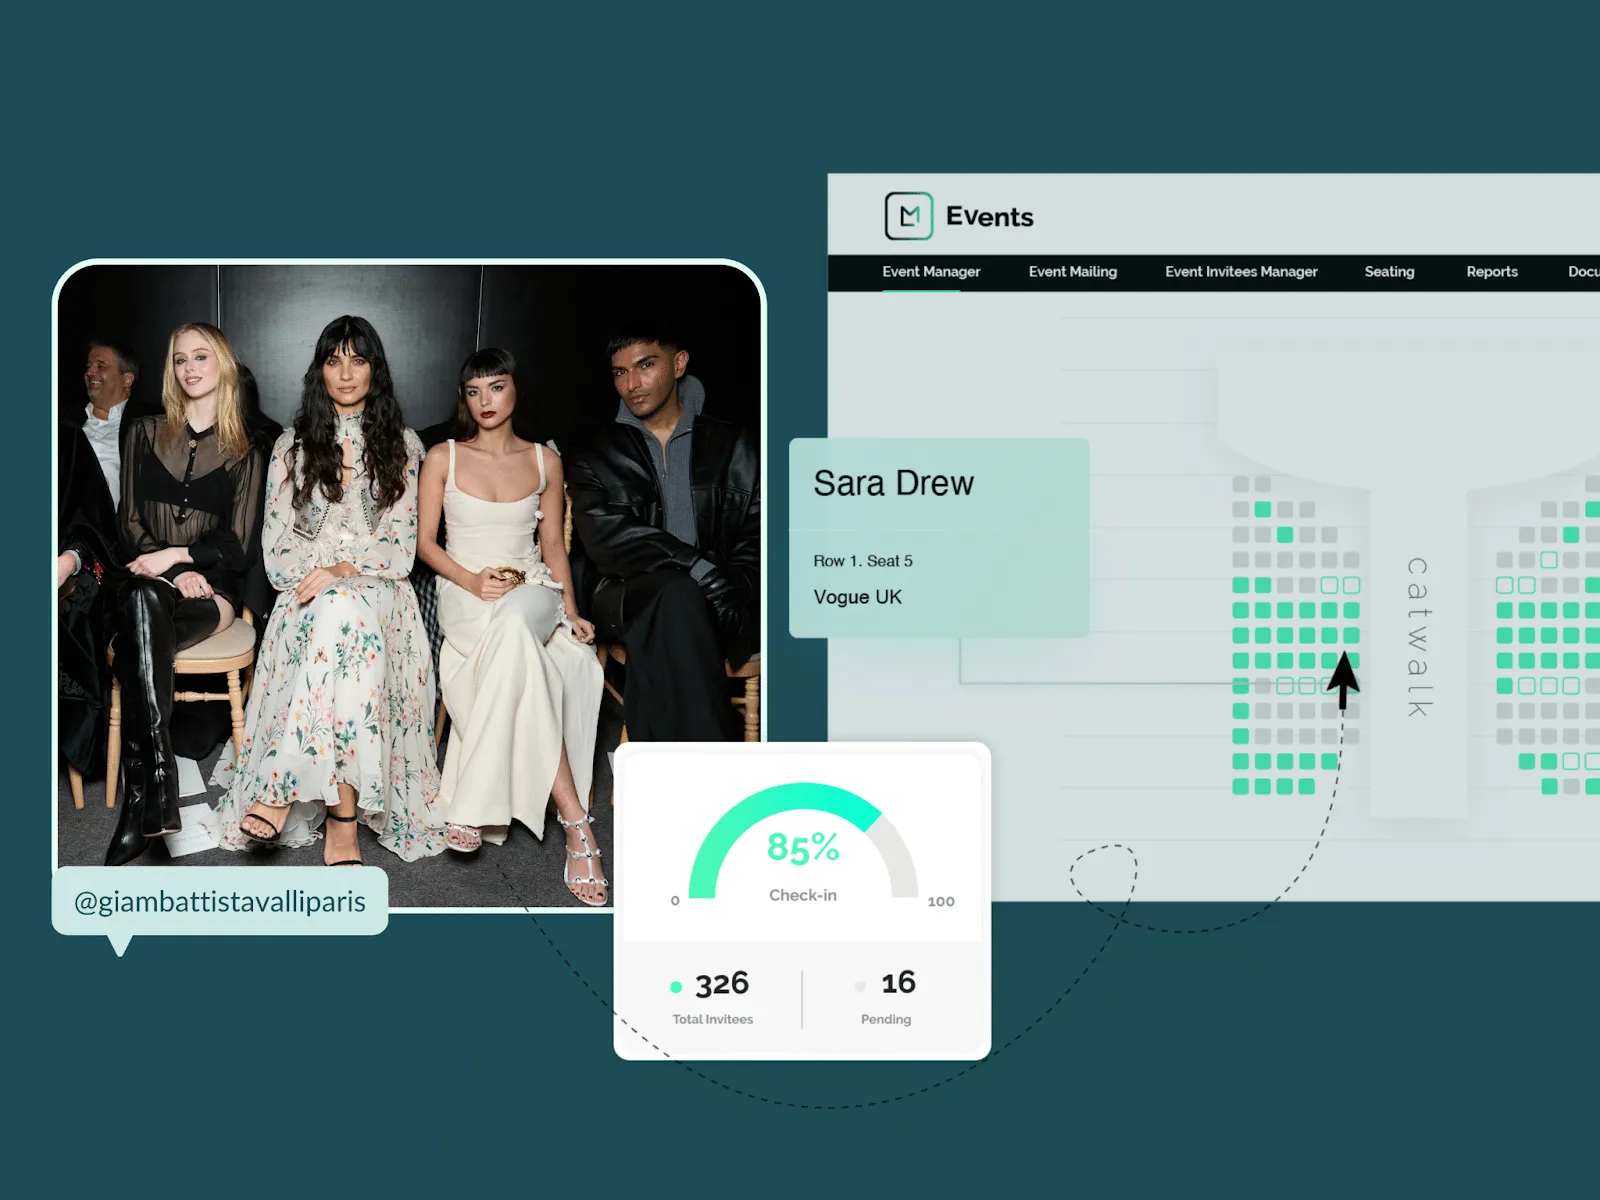
After Fashion Week, a Global Communications Manager at a luxury fashion brand uses Brand Focus to understand how the brand performed and whether the seating plan paid off. In Overview mode, they filter by Paris Fashion Week and see the MIV evolution graph reveal a spike on show day which stays high for the following days, accompanied by the regions amplifying the coverage such as the U.S.
The Voice Mix shows that Media drove the largest share of MIV, as expected. Paired with Brand Association, they see frequent mentions alongside the brand’s biggest competitor; indicating the show reached the right audience tier.
Under view of Celebrity Voice, the A-listers’ seated front row sparked significant social engagement that Media quickly amplified. In fact, in the Top 30 placements, a Vogue feature leads, followed by WWD and Elle, each spotlighting both the collection and its front-row guests.
Lastly, when exploring the Influencer Voice, it highlights a small group of “All-Star” creators who achieved high total MIV from minimal posts, reflecting strong MIV per placement and healthy engagement across social media. These creators stand out as potential candidates for future ambassador partnerships.
Key Takeaways: With these insights, they build a sharp post–Fashion Week report for leadership. The analysis confirms that Media remained the key Voice of authority, amplifying reach and credibility. A-listers in the front row generated strong MIV echoed across editorial coverage, while select Influencers showed high MIV per placement, promising candidates for future ambassadorships. Overall, the show delivered strong ROI from a well-executed seating strategy.
Discover How Your Brand Stacks Up With Launchmetrics
Our Brand Performance Cloud helps FLB brands monitor media performance, benchmark against competitors and uncover what truly drives visibility. With our metrics solutions, you can identify the moments that deliver the greatest impact and turn performance data into clear, strategic direction.
Want to see how it works? Book a demo with our team and discover the full picture of your brand’s performance.
Take a Tour of Launchmetrics
Our platform can help you measure brand performance across events, campaigns and more.
By Pawandeep Kaur