Marketing reporting has never been more complex. While countless digital channels are leveraged, each have their own set of metrics, dashboards and performance indicators. It’s easy to get buried under the weight of data without a clear sense of which numbers truly matter. A smart strategy requires smart reporting, which means focusing on the right KPIs that give a clear picture of performance.
After all, your marketing reports are critical tools to drive your campaign optimization, identify trends and justify your marketing spend.
If you’re in the Fashion, Lifestyle and Beauty (FLB) industries, you’ve likely felt the pressure firsthand. The C-Suite wants clear evidence of ROI, while your teams look to you for guidance on where to invest next. That’s why gaining clarity from your data is so important.
Because at the end of the day, brand performance is a currency. And every activity you launch either contributes to, or detracts from, brand value.
Now, brands are focusing on the KPIs that matter most, cutting through the noise to simplify analysis and enable smarter reporting. With the right KPIs in place, performance reports move beyond surface-level insights to provide clarity on the story behind the results. This is crucial for communicating impact in a way that resonates with stakeholders.
Let’s take a look at what those KPIs are.
The 10 Brand KPIs for PR & Marketing Performance
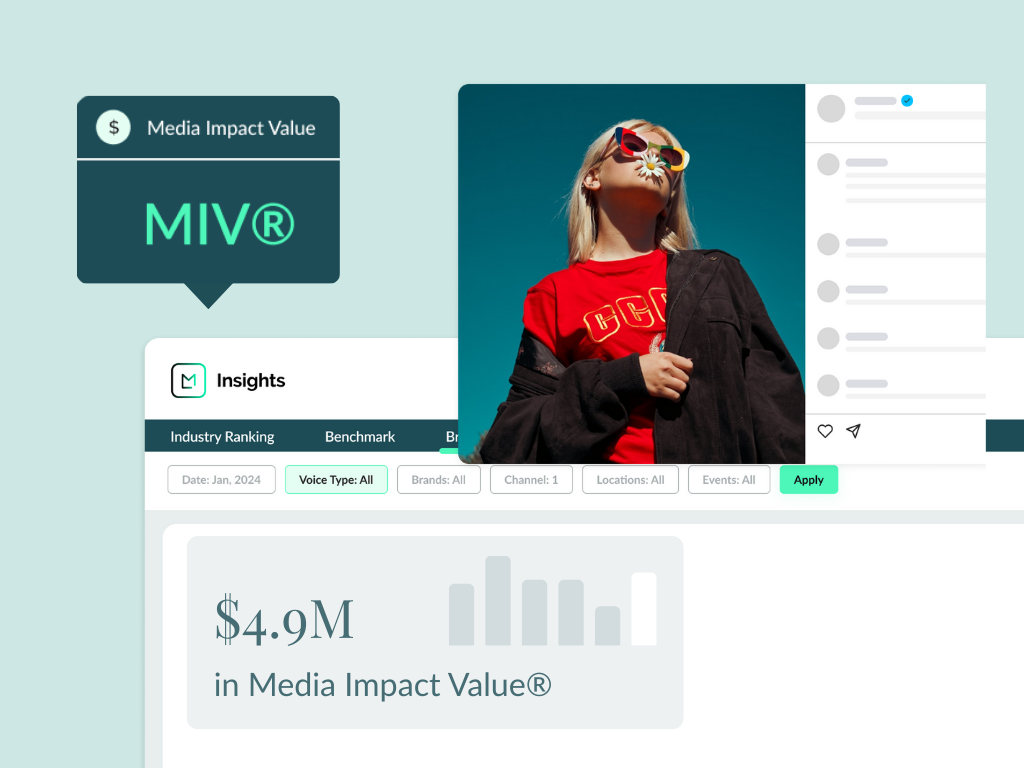
1. Media Impact Value® (MIV®)
Media Impact Value® (MIV®) is a proprietary metric that calculates the monetary value of all your brand’s media coverage—whether it appears online, in print or across social platforms. By factoring in things like reach, engagement, source authority and content quality, MIV translates visibility into a dollar figure, making it easier to prove ROI and compare performance across markets.
Types of questions it answers:
- Which campaign touchpoints (e.g. press coverage, influencers or owned channels) delivered the highest value for our last event?
- Did our recent collection launch generate more value than last season’s, and how did it stack up against competitors?
- Which region delivered the highest-value visibility for our latest product drop?
How it’s used:
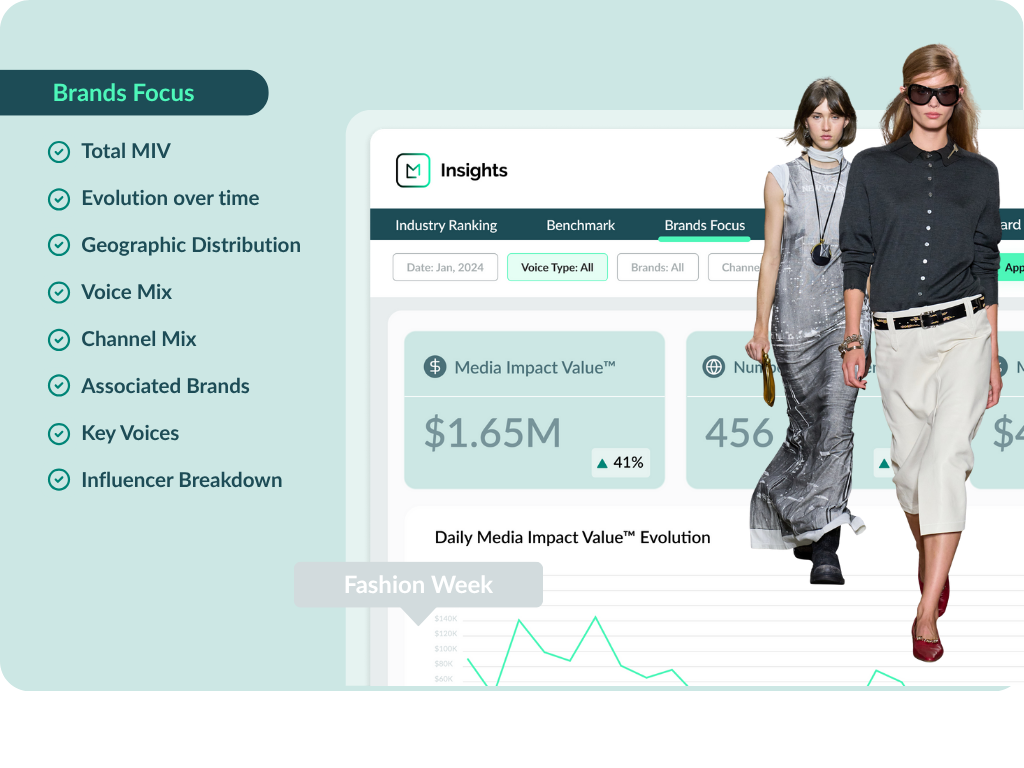
FLB brands use MIV across many different aspects of their marketing reporting, as it’s one of the most powerful brand KPIs for demonstrating ROI to leadership. It can also be used to optimize campaigns and influencer partnerships, benchmark performance against competitors and drive strategic decision-making. For example, you might identify that Influencer collaborations on Instagram generate a much higher MIV than traditional press placements, leading you to invest more in social activations.
2. Voice Mix
There are five distinct Voices that influence the customer journey: Celebrities, Influencers, Media, Owned Media and Partners. Voice Mix shows the percentage of coverage, or percentage of MIV, generated for your brand by each of these Voices.
Types of questions it answers:
- Which Voice is driving the most value for our brand right now?
- Has the balance of Voices shifted over time, and what does that mean for our strategy?
- Which Voices are our competitors gaining the most traction from?
How it’s used:
Voice Mix is a powerful brand KPI as it allows you to see which Voices are delivering the most value. In Launchmetrics Insights, you can track Voice Mix over time and against competitors to determine your strengths, weaknesses and opportunities across channels. For example, maybe your brand relies heavily on Influencers, but underperforms in Media compared to competitors. Armed with this insight, you might redirect some resources to strengthening press relationships to better invest and perform in the Media Voice.
3. Share of Value
Share of Value shows you what slice of the conversation your brand really owns. It takes the total MIV in a category and breaks down how much is driven by your brand, a specific Voice, channel or event. In other words, it highlights where your visibility is strongest and identifies where competitors may be gaining ground.
Types of questions it answers:
- What share of the conversation in our category do we own, and is it growing or shrinking?
- Did our share increase during a specific key moment (like a fashion week or product launch)?
- Where are our competitors starting to get ahead, and what are they doing differently?
How it’s used:
FLB brands often use Share of Value to see how they stack up against the competition and to spot areas where they’re over- or underperforming. As an example, you might analyze a major event such a the Met Gala to see which brand gained the biggest share of MIV, and then take note of the strategies they used to dominate so you can re-strategize for future events.
4. Share of Voice
Share of Voice shows how much of the conversation in your space is about your brand compared to competitors. Instead of looking at the value of coverage, it focuses on volume: the percentage of total media mentions your brand gets within a given timeframe, event or market.
Types of questions it answers:
- What portion of the overall conversation in our category is about our brand? And is it increasing?
- How much visibility did we gain during a major event?
- Which competitor is getting the most attention right now, and why?
How it’s used:
Share of Voice helps FLB brands see how much attention they’re getting in a busy market. Let’s say your brand takes a big share of the conversation on social media during a collection launch, only to see your SoV dip once competitors roll out their own campaigns. Knowing this lets you plan smarter follow-ups to keep the buzz going and make sure your brand stays visible when it matters most.
5. Channel Mix
Channel Mix shows the percentage of MIV your brand generates across different channel types—print, online and social—over a set period. It highlights which channels are delivering the most value, so you can focus your resources where your audience is most engaged.
Types of questions it answers:
- Which channels are giving us the strongest ROI this season: print, online or social?
- How has our channel mix shifted compared to last year’s campaign?
- Are we over-relying on one platform more than another?
How it’s used:
Channel Mix helps brands fine-tune their media strategy by showing where traction is coming from. For example, your latest marketing performance report might show that, while Instagram still drives the largest Share of Value for your brand, TikTok is quickly gaining ground and warrants greater marketing investment.
6. Evolution of Placements
Evolution of Placements tracks how often your brand is being talked about across articles, posts or interactions, and how that visibility shifts over time. It highlights whether your coverage is on the rise, holding steady or starting to decline. When combined with MIV, it also shows whether more mentions are actually creating more value, or if your visibility is growing without meaningful impact.
Types of questions it answers:
- Are we gaining more brand mentions this quarter, and do they coincide with a rise in MIV?
- Which types of placements (e.g., press, influencer posts or owned content) deliver the most impact?
- How does our placement growth compare with competitors during key events?
How it’s used:
A key way brands can use Evolution of Placements to spot trends in coverage and understand what’s driving them. An example might be looking for jumps in the number of placements your brand (or a competitor) receives and then exploring the underlying cause of that spike. In Launchmetrics Insights, you can filter placements by Voice, channel or market, and pair placement volume with MIV to see whether more mentions are actually translating into more value.
7. Engagement
Engagement refers to how well audiences interact with a given piece of content. It includes things like shares, comments, likes and saves. Engagement is important because it means people aren’t just passively consuming content about your brand, but actually engaging with it on some deeper level.
Types of questions it answers:
- Which pieces of content generated the strongest reactions from our audience?
- How does engagement vary by channel, region or Voice?
- Do campaigns with higher engagement also deliver stronger MIV?
How it’s used:
Engagement rates are commonly used reporting metrics because they offer a simple way to measure how well content resonates with an audience. This gives you a window into understanding consumer preferences and a basic way to gauge campaign performance. Though useful, engagement alone is limited as a brand KPI: high engagement doesn’t always mean high impact or ROI, which is why brands often pair it with more holistic measures like MIV to get a full picture of their performance.
8. Reach
Reach is the total number of unique people who are exposed to your brand’s content. It gives you an idea of the potential size of your audience and how far your campaigns are spreading, and can be used for any channel, from social media to magazine articles.
Types of questions it answers:
- Did our latest influencer partnerships cause our overall audience size to grow?
- How many unique people saw our brand content this season?
- Which channels are driving the widest visibility for our brand?
How it’s used:
Reach is another widely used metric in marketing reporting for assessing the scale of exposure gained. However, like engagement, it only shows you part of the picture and is most valuable when paired with other KPIs. For example, a Celebrity post may generate a high reach but low engagement, while a Mid-Tier Influencer post with lower reach might deliver more actual impact.
9. Brand Association
Brand Association tracks which brands are most often mentioned alongside yours. This helps with understanding consumer perception as well as with brand positioning. It can also help you determine potential partnerships and highlight where your content overlaps with competitors.
Types of questions it answers:
- Are the brands we’re most often associated with reinforcing or diluting our positioning?
- Do our associations reflect current consumer trends, like sustainability or inclusivity?
- Are we consistently linked with the right market segment, or are we associated with competitors outside our desired space?
How it’s used:
Tracking Brand Association in your marketing reporting can help you get a clearer view of how your brand is positioned. For example, let’s say sustainability is a core value for your brand. You might see your name frequently linked with direct competitors in luxury fashion, but rarely alongside sustainable brands, highlighting an opportunity to strengthen your messaging.
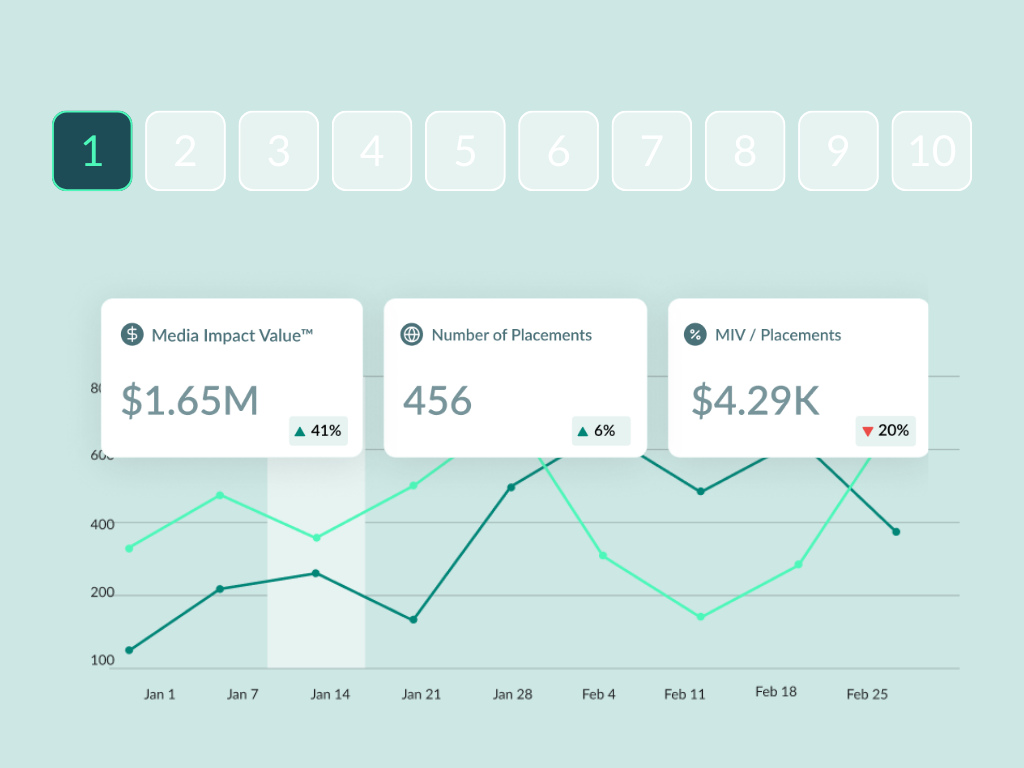
10. MIV Per Placement
MIV Per Placement reveals the average value generated by each piece of coverage your brand gets. This brand KPI helps you to understand the correlation between the volume of media mentions you get and their quality and value.
Types of questions it answers:
- Are we investing in channels that deliver quality visibility or just quantity?
- Is our average placement value improving over time, or has it plateaued?
- How does the average value of our latest campaign’s placements compare to previous launches?
How it’s used:
MIV Per Placement helps brands focus on quality over quantity. For example, you might find that while one campaign generated a high number of placements, another produced fewer mentions that each carried much higher value. These insights help identify the Voices, channels or content types that consistently deliver the strongest impact, which can in turn guide your future decision-making.
A Real-World Example of Essential KPIs in Action
Let’s take a look at a real-world example of how some of these essential KPIs can be used when analyzing the performance of competitors. Say a luxury watch brand wants to understand which Voices are driving the strongest impact for competitors like Jacob & Co. Using Launchmetrics Insights, they can see that, at first glance, the brand’s Owned Media appears to dominate, generating more than 1,100 placements in just six months, each worth an average of $45.9K MIV per placement.
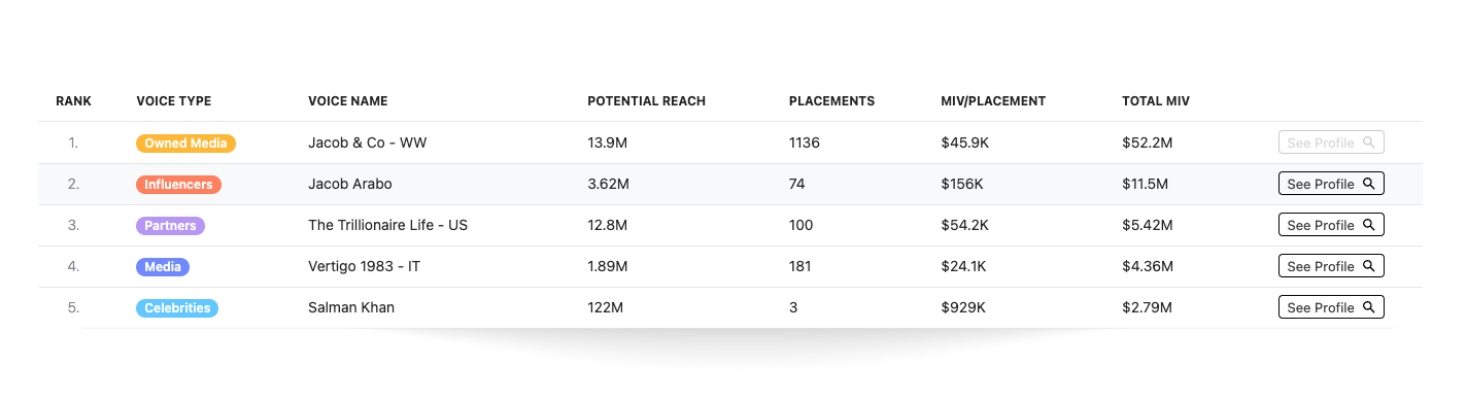
But by digging deeper into MIV Per Placement, they can see the picture at a more nuanced level. While Owned Media delivered volume, founder Jacob Arabo’s personal Instagram presence—accounting for just 74 placements—achieved far greater impact, averaging $156K MIV Per Placement. His posts regularly reached more than 3 million followers, with one alone driving $524K in MIV.
This shows how value can come from unexpected places, and often from beyond high-cost collaborations. As we can see, using KPIs like Voice Mix, MIV and MIV Per Placement, in combination with other essential KPIs, can bring clarity in marketing reporting and help brands make smarter, more confident decisions.
How Launchmetrics Provides a Holistic View for Smarter Decisions
Bringing all of these KPIs together into a single, cohesive view is where the real power lies. On their own, metrics like engagement, reach or MIV provide useful snapshots. But when combined, they create a complete picture of how your brand is performing across Voices, channels and markets.
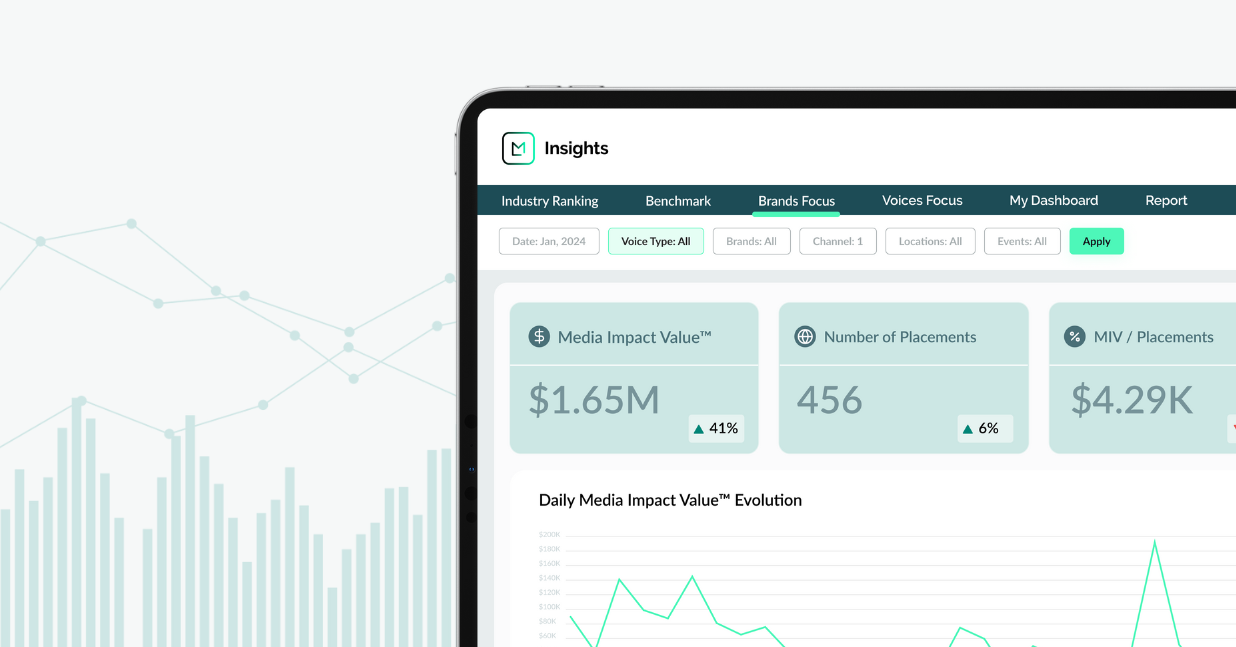
As one of the most advanced marketing reporting tools, Launchmetrics Brand Performance Cloud unifies essential KPIs—MIV, Share of Value, Voice Mix, Channel Mix and more—into one place, giving brands a 360° view of their performance. Instead of fragmented data from different sources, multiple systems and individual reports, you can get actionable insights at your fingertips, all presented in customizable visual dashboards.
With Launchmetrics, brands can:
- Benchmark performance within their industry and against key competitors
- Spot top performers, rising brands, and the strategies driving their success
- Measure global impact across Channels, Voices and markets in real time
- Refine budget allocation and strategy across media, retail and influencer partnerships
- Prove ROI by linking marketing and PR activities directly to brand value
Together, these capabilities transform marketing reporting from a time-consuming and ineffective task into a clear, strategic asset for your brand.
Want to learn more?
Download the full “10 Essential KPIs” guide for a deeper dive, including more brand examples.
Get the guide to 10 Essential brand KPIs
You’ll learn how to measure and report on brand performance with greater clarity, supported by deeper examples of effective brand measurement.
By Launchmetrics Content Team